The realm of data analysis is rife with intricacies, but amidst the complexities lies a formidable tool: Excel. Among its many wonders, Excel empowers us with the ability to unravel the hidden patterns and trends within any given dataset through a statistical measure known as standard deviation. Ready yourself as we embark on an enlightening journey, deciphering the mysteries of standard deviation using the versatile Excel.

Image: www.pscraft.ru
What Lies Beyond the Veil of Standard Deviation?
Standard deviation, often abbreviated as “SD,” serves as a quantitative measure of the dispersion or variability within a dataset. It signifies how far each data point strays from the mean or average. In layman’s terms, a high standard deviation indicates a dataset with values spread far apart, while a low standard deviation implies values clustered tightly around the mean. By harnessing the power of standard deviation, researchers, analysts, and decision-makers gain priceless insights into the behavior of their data.
Embarking on Our Excel Odyssey
To calculate standard deviation in Excel, we employ the STDEV() function. This majestic formula accepts an array or range of numerical values and returns the standard deviation as an output. Let’s dive into a practical example to witness its prowess in action.
Suppose you possess a dataset of sales figures for the past year, neatly arranged in column A of an Excel spreadsheet. To calculate the standard deviation of these sales figures using Excel, follow these simple steps:
- Position the cursor in an empty cell where you desire the standard deviation to appear.
- Type the following formula into the formula bar:
=STDEV(A1:A100)
Where A1:A100 represents the range of cells containing your sales figures.
- Press “Enter” and behold the standard deviation of your dataset, displayed in the selected cell.
A Deeper Dive into the Essence of Standard Deviation
Comprehending the concept of standard deviation is paramount for astute data analysis. It provides a wealth of valuable information about the underlying distribution of your data:
- Spread of Data: A large standard deviation indicates a significant spread of data points, while a small standard deviation suggests a more concentrated distribution.
- Outliers: A high standard deviation may indicate the presence of extreme values or outliers within the dataset. These outliers can potentially skew the mean and impact decision-making, so it’s crucial to identify and handle them judiciously.
- Data Reliability: Standard deviation can serve as a measure of data reliability. A high standard deviation could signal potential errors or inconsistencies in the data collection process.
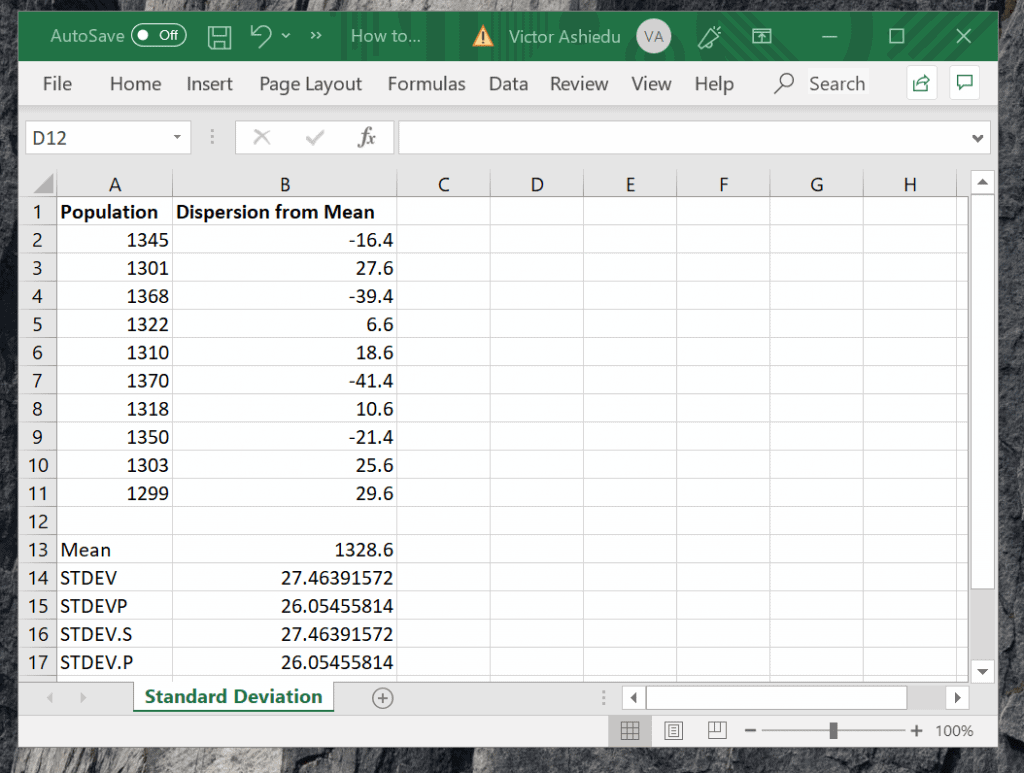
Image: haipernews.com
Standard Deviation Beyond Excel
While Excel reigns supreme for basic standard deviation calculations, other statistical software packages offer more advanced functionalities:
- Statistical Programming Languages: Python, R, and SAS provide robust libraries for advanced statistical analysis, including comprehensive standard deviation calculations and hypothesis testing.
- Cloud-Based Analytics Platforms: Platforms like Azure Machine Learning and Google Cloud Platform Machine Learning offer cloud-based solutions for extensive data analysis, empowering users with automated standard deviation calculation, visualization, and interpretation.
How To Find The Standard Deviation Using Excel
Mastering Standard Deviation: Empowerment at Your Fingertips
By mastering the art of standard deviation in Excel, you unlock a powerful analytical tool that opens doors to a deeper understanding of your data. You’ll gain the ability to make informed decisions, identify outliers, and uncover hidden patterns that could transform your business or research. Embrace the power of standard deviation, and let Excel guide you towards data-driven insights and informed decisions.

/GettyImages-1303637-two-way-mirror-57126b585f9b588cc2ed8a7b-5b8ef296c9e77c0050809a9a.jpg?w=740&resize=740,414&ssl=1 "Unveiling the Illusion – A Comprehensive Guide to Detecting Two-Way Mirrors")


